
TL;DR
This blog targets PTE Academic test-takers, university applicants, student visa candidates, and skilled migration/PR aspirants who want to understand the PTE score chart, required PTE scores, and score equivalency for admission or immigration purposes.
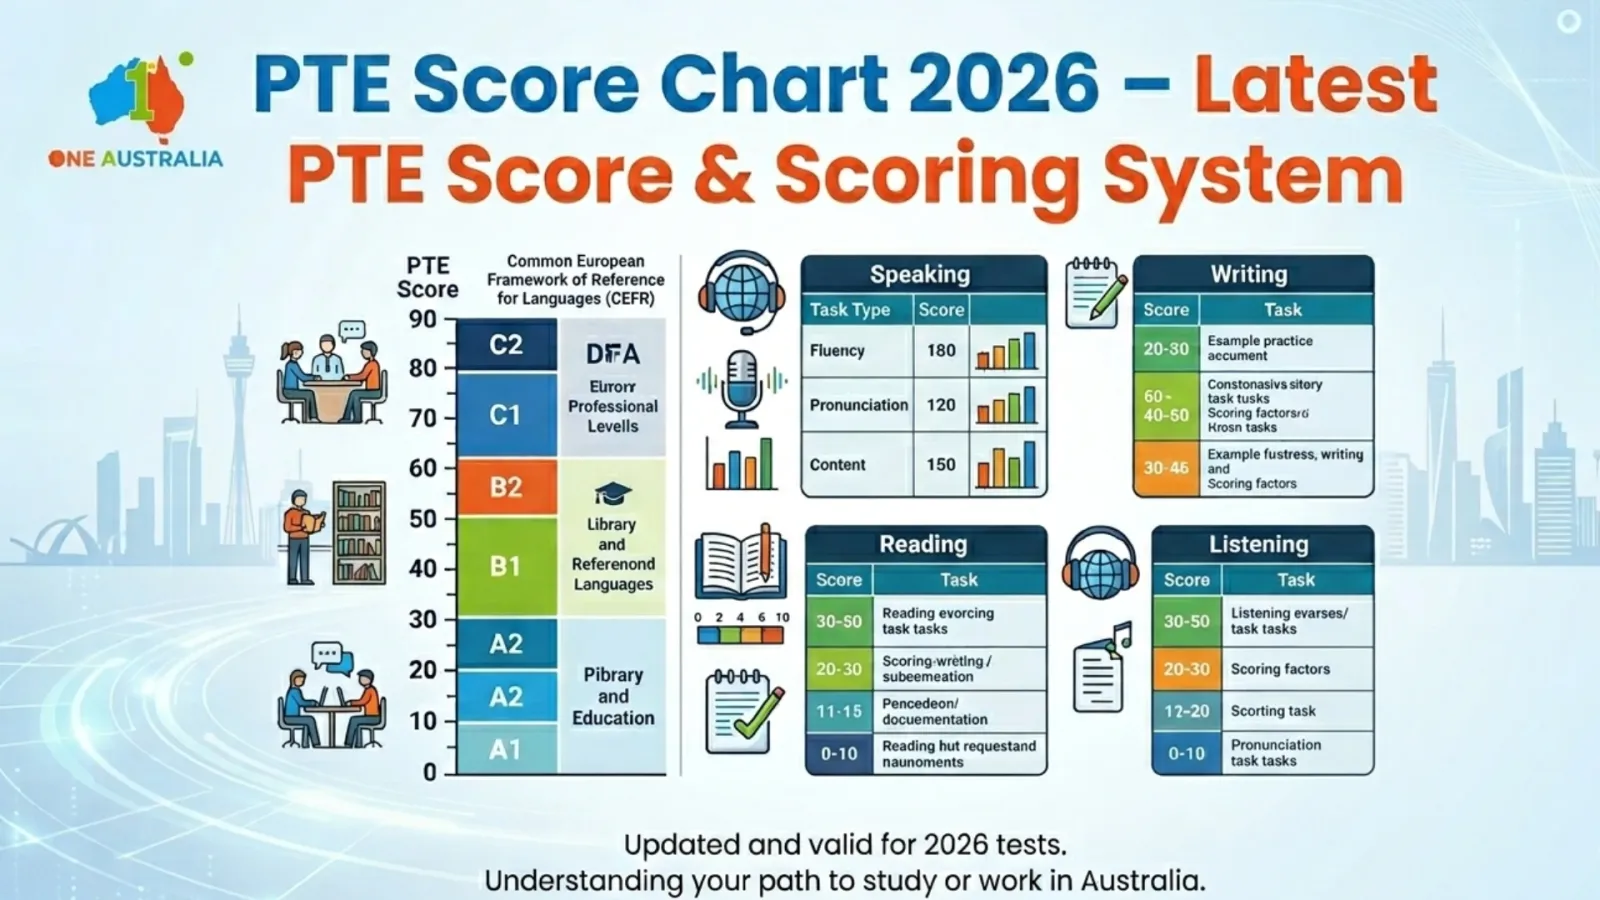
It explains the latest PTE score chart, including the 10–90 scale, CEFR mapping (A1–C2), and how scores translate into English proficiency levels for academic and professional evaluation.
The blog clarifies how PTE scores are calculated using automated AI scoring, integrated tasks, communicative skills, enabling skills, and weighted overall score calculation helping students understand why scores vary.
It analyzes the PTE score distribution chart, explains why most candidates score between 50–65, why 79+ is difficult, and provides a detailed module-wise breakdown (Listening, Reading, Speaking, Writing) for strategic improvement.
The blog includes PTE score comparison with IELTS, TOEFL, and CLB, explains PTE score equivalents, and defines what is considered a good PTE score for university admission, student visa, and PR pathways.
Related blog
What Is the Latest PTE Score Chart?
The latest PTE Score Chart is the official scoring framework used in PTE Academic to report a candidate’s performance on a 10–90 scale. This PTE Score Chart shows how your overall PTE score and individual module results (Listening, Reading, Speaking, and Writing) are calculated and displayed in your official report.
Many students search for the new PTE Score Chart or even the PTE new score chart to check whether there have been recent updates. While the scoring scale remains 10–90, the structure of the PTE Score Chart clearly explains how communicative skills and enabling skills contribute to your final result.
The PTE Score Chart for each module section helps candidates understand how scores are distributed across Listening, Reading, Speaking, and Writing. In addition, the PTE score distribution chart within the PTE Score Chart provides insight into how scores are spread across different performance levels, helping test-takers understand what is considered an average, good, or high PTE score.
This comprehensive PTE Score Chart guide ensures that you not only see your numbers but also understand what they mean for university admissions, visa applications, and professional registration.
PTE Score Scale (10–90 Range + CEFR Mapping)
The PTE Academic exam follows a precise scoring system ranging from 10 to 90. Unlike band-based exams, pte scores are calculated using AI scoring and reported as whole numbers. This makes the pte score table easy to interpret and directly comparable with global English standards like CEFR.
Many students search for the latest PTE score chart or pte scoring chart to understand how their results translate into English proficiency levels. Below is a clear pte score table explaining the 10–90 scale along with CEFR mapping.
PTE Score Table (10–90 Scale Explained)
Here is the complete pte score table aligned with CEFR levels:
| PTE Score | English Level (CEFR) | Description |
| 85–90 | C2 Expert | Near native fluent English |
| 76–84 | C1 Advanced | Strong academic English |
| 59–75 | B2 Upper-Intermediate | Able to handle complex texts |
| 43–58 | B1 Intermediate | Solid mid-range skills |
| 30–42 | A2 Basic | Limited communication |
| 10–29 | A1 Beginner | Early language use |
This PTE Score Chart helps learners clearly interpret their English proficiency level in a structured and globally recognized format. By mapping scores directly to CEFR standards, it removes confusion and allows students to quickly understand whether they are at a basic, intermediate, or advanced stage. It also makes it easier to set realistic target scores for study abroad, migration, or professional requirements.
For example:
A score of 65 places you in B2 (Upper-Intermediate).
A score of 79 places you in C1 (Advanced).
A score of 88 reflects C2-level proficiency.
The new PTE Score Chart continues to use this 10–90 global scale, ensuring consistency across all modules Speaking, Writing, Reading, and Listening , while helping candidates track progress more effectively and prepare strategically for higher scores.
PTE Score in Bands vs CEFR Levels
Although PTE does not officially use bands like IELTS, many students search for pte score in bands. Technically, PTE uses a numerical scale, not band descriptors.
However, to simplify understanding, the table above shows how pte score in bands can be interpreted through CEFR levels.
This is where pte scores explained becomes important:
IELTS Band 7 roughly aligns with PTE 65–72 (B2–C1 transition).
IELTS Band 8 roughly aligns with PTE 79–84 (C1 level).
IELTS Band 9 aligns with PTE 85+ (C2 level).
So while there is no official “band” system in PTE, students often interpret pte scores in grouped ranges for easier comparison, especially when referring to the pte band score chart latest..
If you are reviewing the pte new score chart or pte score in bands, always remember:
PTE scores are AI-calculated.
Scores reflect overall communicative ability.
CEFR mapping helps universities and immigration authorities understand your level clearly
How PTE Score Is Calculated?
PTE scores are calculated using an AI-based automated scoring system that evaluates your performance across Listening, Reading, Speaking, and Writing. The exam uses a 10–90 scale, and your score reflects overall communicative ability rather than just correct answers. Unlike traditional exams, PTE assesses integrated tasks, meaning one response can contribute to multiple skill scores.
Key Points:
AI Scoring System: Fully automated, data-driven evaluation with no human bias.
Communicative Skills: Four scores (Listening, Reading, Speaking, Writing) each graded from 10–90.
Integrated Tasks: Tasks like Repeat Sentence and Write From Dictation affect more than one skill.
Enabling Skills Impact: Grammar, pronunciation, fluency, vocabulary, and spelling influence final results.
Overall Score: Not a simple average — it is calculated using weighted performance across all tasks.
Understanding this scoring structure helps you focus on high-impact areas instead of random practice.
PTE Score Distribution Chart (How Scores Are Spread)
Most websites simply publish a pte score table or a static new pte score chart. Very few actually explain how scores are distributed among real test takers.
Understanding the pte score distribution chart (pte score breakdown) helps you set realistic targets, plan preparation strategy, and understand why certain score jumps feel much harder than others.
Let’s break it down properly.
Where Most Candidates Score (50–65 Range)
In a typical pte score distribution chart, the highest concentration of candidates falls between 50 and 65.
This range represents:
Upper B1 to mid-B2 CEFR level
Functional academic English
Basic fluency with noticeable inconsistencies
Why is this the “crowded zone”?
Because most candidates:
Speak fluently but lack advanced vocabulary
Make minor grammar errors
Lose marks in Listening due to fast pace
Struggle with complex summarization in Writing
This creates a distribution peak around 58–63, forming the top of the bell curve.
Think of this as the “performance comfort zone.”
Breaking out of it requires structured skill refinement not just more practice.
High Score Distribution (79+ Range)
Scores of 79+ fall into the C1–C2 proficiency level and represent the advanced tier.
In most competitive scoring environments:
73–78 → Strong performers
79+ → Top-tier academic level
85+ → Very small percentage
90 → Rare and near-native proficiency
On a pte score distribution chart, this area appears as a narrowing tail on the right side of the curve.
Why is this group smaller?
Because scoring above 79 requires:
Consistent fluency without hesitation
Advanced collocations and academic vocabular
High listening retention accuracy
Strong pronunciation clarity
Zero weak module
At this level, even minor hesitation or pronunciation inconsistency can prevent the score jump.
What Percentile Ranges Typically Look Like
While exact official percentile breakdowns are not publicly detailed, typical academic test patterns suggest the following clustering:
| PTE Score Range | Performance Tier | Estimated Relative Standing |
| 50–58 | Average cluster | Central majority |
| 59–65 | Above average | Strong migration range |
| 66–72 | Competitive academic | Upper-middle group |
| 73–79 | High performers | Top 15–20% range |
| 80+ | Elite academic | Top 10% or better |
On a visual pte score distribution chart, this would resemble a classic bell curve:
Highest peak around 55–63
Gradual decline from 65–75
Sharp tapering beyond 80
This pattern explains why moving from 58 to 65 feels achievable, but moving from 65 to 79 feels dramatically harder.
PTE Score Chart Each Module
Understanding the pte score chart each module is essential if you want to move beyond average performance. While many students focus only on overall results, the real improvement strategy starts with analyzing how pte scores are calculated in each skill.
The official pte scoring chart evaluates Listening, Reading, Speaking, and Writing separately and then combines them into your overall score (10–90 scale).
Below is a clear breakdown of the pte score chart each module, so you can identify which skill is limiting your final result.
Listening Score Chart
The Listening section measures your ability to understand spoken English in academic contexts.
Skills Evaluated:
Summarize Spoken Text
Multiple Choice
Fill in the Blanks
Highlight Incorrect Words
Write from Dictation
Listening Score Impact:
Strong weighting from Write from Dictation
Spelling accuracy significantly affects scores
Integrated listening-writing tasks boost overall marks
| Listening Score Range | Performance Level |
| 79+ | Advanced comprehension with near-perfect accuracy |
| 65–78 | Strong academic listening ability |
| 50–64 | Functional understanding with minor gaps |
| Below 50 | Difficulty handling complex audio |
Listening is often the deciding factor in reaching 79+ because it heavily influences integrated scoring.
Reading Score Chart
The Reading module evaluates comprehension, vocabulary control, and logical understanding of academic texts.
Skills Evaluated:
Reading & Writing Fill in the Blanks
Multiple Choice (Single & Multiple)
Re-order Paragraphs
Scoring Characteristics:
Vocabulary depth matters significantly
Grammar accuracy impacts fill-in-the-blanks
Logical sequencing affects paragraph tasks
| Reading Score Range | Performance Level |
| 79+ | Advanced academic reading |
| 65–78 | Strong comprehension skills |
| 50–64 | Moderate understanding |
| Below 50 | Limited text processing ability |
In the pte score chart each module, Reading often reflects vocabulary strength and grammar precision.
Speaking Score Chart
Speaking is one of the most influential modules in the pte scoring chart because it affects both Speaking and overall Communicative Skills.
Skills Evaluated:
Read Aloud
Repeat Sentence
Describe Image
Re-tell Lecture
Answer Short Question
Key Scoring Factors:
Oral Fluency
Pronunciation
Content accuracy
| Speaking Score Range | Performance Level |
| 79+ | Natural fluency, clear pronunciation |
| 65–78 | Good fluency with minor hesitation |
| 50–64 | Understandable but inconsistent |
| Below 50 | Noticeable fluency/pronunciation issues |
Most candidates stuck at 65 struggle to eliminate hesitation patterns. Speaking refinement is critical for crossing 79.
Writing Score Chart
Writing assesses structured communication and grammar accuracy.
Skills Evaluated:
Summarize Written Text
Essay Writin
Scoring Focus:
Grammar range and accuracy
Vocabulary sophistication
Coherence and logical structure
| Writing Score Range | Performance Level |
| 79+ | Strong academic argumentation |
| 65–78 | Clear structured writing |
| 50–64 | Basic idea development |
| Below 50 | Grammar and structure weaknesses |
In many cases, Writing becomes the hidden barrier in achieving balanced pte scores across all modules.
Why Module-Level Analysis Matters
The pte score chart each module reveals an important truth:
Your overall score can never exceed your weakest skill by a large margin.
For example:
Listening 82
Reading 79
Speaking 66
Writing 75
Overall score will likely remain restricted around the mid-70s because Speaking limits the final outcome.
This is why analyzing the pte score chart each module gives you a ranking advantage both in exam strategy and SEO visibility.
Many competitors publish only an overall score table. A detailed module breakdown in the pte score chart can rank independently for module-specific search queries and attract highly targeted traffic.
PTE Exam Sections and Score Distribution
Understanding the PTE exam sections and pte score distribution helps candidates identify how different parts of the test contribute to their final result. The PTE Academic exam evaluates four main communicative skills: Speaking, Writing, Reading, and Listening. Each section includes different question types designed to measure specific language abilities.
Unlike traditional exams where each question contributes to only one section, PTE uses an integrated scoring system. This means some tasks can influence more than one skill score at the same time. For example, Repeat Sentence evaluates both Speaking and Listening, while Write From Dictation impacts Listening and Writing performance.
The pte marks distribution is based on how well candidates perform across these sections and their ability to demonstrate real-world English communication skills. Reviewing the pte score distribution chart helps students understand which tasks have a stronger impact and where they should focus their preparation. Understanding the pte score distribution also allows candidates to create a targeted study plan and improve performance in high-weighted tasks.
PTE Academic Exam Sections and Score Distribution Chart
Section | Skills Tested | Major Tasks |
Speaking & Writing | Speaking + Writing | Read Aloud, Repeat Sentence, Describe Image, Retell Lecture, Essay Writing |
Reading | Reading + Writing Impact | Reading & Writing Fill in the Blanks, Reorder Paragraphs, Multiple Choice |
Listening | Listening + Writing Impact | Summarize Spoken Text, Highlight Incorrect Words, Multiple Choice, Write From Dictation |
PTE Speaking Marks Distribution
The PTE Speaking marks distribution is based on different question types that test fluency, pronunciation, and speaking accuracy. Due to the integrated scoring system, some tasks also impact other skills. Understanding the pte score distribution chart helps candidates focus on high-impact tasks.
Question Type | Skills Impacted | Importance |
Read Aloud | Reading + Speaking | High |
Repeat Sentence | Listening + Speaking | Very High |
Describe Image | Speaking | Medium |
Retell Lecture | Listening + Speaking | High |
Answer Short Question | Listening + Speaking | Low |
Repeat Sentence and Read Aloud usually have the strongest impact because they assess pronunciation, fluency, and comprehension together.
PTE Writing Marks Distribution
The PTE Writing marks distribution evaluates grammar, vocabulary, sentence structure, and written communication. The pte marks distribution includes integrated tasks where one response can affect multiple skills.
Question Type | Skills Impacted | Importance |
Summarize Written Text | Reading + Writing | Medium |
Essay Writing | Writing | High |
Write From Dictation | Listening + Writing | Very High |
Write From Dictation is a high-impact task because it improves both writing and listening scores through accurate spelling, grammar, and comprehension.
PTE Reading Score Distribution
The pte score distribution for Reading measures vocabulary, comprehension, grammar, and logical understanding. Reviewing the pte score distribution chart helps candidates identify which tasks require more preparation.
Question Type | Importance |
Reading Fill in the Blanks | High |
Reorder Paragraphs | Medium |
Multiple Choice | Low |
Reading Fill in the Blanks usually carries strong importance as it tests vocabulary and grammar together.
PTE Listening Score Distribution
The PTE Listening score distribution focuses on understanding spoken English, identifying key information, and accurately responding to audio tasks. The pte marks distribution includes integrated tasks that can influence multiple skills.
Question Type | Skills Impacted | Importance |
Summarize Spoken Text | Listening + Writing | Medium |
Multiple Choice | Listening | Low |
Highlight Incorrect Words | Listening + Reading | Medium |
Write From Dictation | Listening + Writing | Very High |
Write From Dictation is one of the most important listening tasks because it requires accurate listening, spelling, and writing skills, making it highly valuable for improving overall PTE performance.
PTE Question Type Weightage and Score Impact
Understanding PTE question weightage is one of the most important parts of exam preparation because not all question types contribute equally to your final score. The PTE marks distribution is based on an integrated scoring system, where some tasks evaluate multiple language skills and have a greater impact on your overall result.
Many candidates make the mistake of spending equal time on every question type. However, focusing on the important PTE questions with higher score impact can help improve multiple skills and increase your chances of achieving target scores such as 65+, 79+, or higher.
PTE Question Types and Score Impact Chart
Task | Skills Impacted | Importance |
Repeat Sentence | Speaking + Listening | Very High |
Write From Dictation | Listening + Writing | Very High |
Read Aloud | Reading + Speaking | High |
Reading Fill in the Blanks | Reading + Writing Impact | High |
Retell Lecture | Speaking + Listening | Medium |
Summarize Spoken Text | Listening + Writing | Medium |
Multiple Choice Questions | Individual Skill | Low |
High-Impact PTE Tasks
Some tasks have a stronger influence because they assess more than one skill at the same time.
Repeat Sentence
Tests listening retention, pronunciation, and oral fluency.
Directly impacts Speaking and Listening scores.
Considered one of the most valuable tasks for candidates targeting 79+ scores.
Write From Dictation
Measures listening accuracy, memory, spelling, and written accuracy.
Contributes to both Listening and Writing scores.
Small improvements in this task can create significant score gains.
Read Aloud
Evaluates pronunciation, reading ability, and speaking fluency.
Helps improve both Reading and Speaking performance.
Requires accuracy, natural pace, and clear delivery.
Medium and Lower Impact Tasks
Tasks such as Retell Lecture and Summarize Spoken Text still play an important role but generally have a moderate impact compared with high-weight integrated tasks.
Multiple Choice questions test comprehension but usually have a lower influence on overall score improvement compared with tasks that affect multiple skills.
PTE Score Calculation Example
Understanding how PTE score is calculated can help candidates understand why their final result may not always match a simple average of individual section scores. The PTE Academic scoring system uses an integrated approach where different tasks contribute to multiple skills, and the overall score is calculated based on performance across the entire exam.
Many students assume that if they achieve similar marks in Speaking, Writing, Reading, and Listening, their overall score will simply be the average of these four modules. However, the PTE overall score is not a simple average. It is calculated using a weighted scoring model that considers performance across different question types and language skills.
Example: PTE Task Performance
Task Performance | Result |
Repeat Sentence | 85 |
Write From Dictation | 82 |
Read Aloud | 78 |
In this example, the candidate performs strongly in high-impact tasks. Since these tasks contribute to multiple skills, they can significantly influence the final score outcome.
Final PTE Skill Scores
Skill | Score |
Speaking | 79 |
Writing | 76 |
Reading | 74 |
Listening | 82 |
Overall Score | 79 |
Why the Overall PTE Score Is Not a Simple Average
If we calculate the average of the four skill scores:
(79 + 76 + 74 + 82) ÷ 4 = 77.75
However, the candidate receives an overall PTE score of 79, because the PTE scoring system does not calculate results using a basic mathematical average.
The final score considers:
Performance across different question types
Integrated tasks that affect multiple skills
Communicative skills evaluation
Overall language ability demonstrated throughout the exam
For example:
Repeat Sentence improves both Speaking and Listening performance.
Write From Dictation impacts Listening and Writing scores.
Read Aloud contributes to Reading and Speaking ability.
This is why mastering high-impact tasks can create a greater improvement in your final result compared with focusing only on individual sections.
Understanding this PTE score calculation example helps candidates interpret their score report more effectively and develop a preparation strategy based on task impact rather than only module scores.
How to Use PTE Question Weightage for Preparation
Understanding the PTE marks distribution allows you to create a smarter preparation strategy:
Prioritise high-impact tasks first.
Practice integrated tasks regularly.
Analyse your weak skills instead of only counting correct answers.
Spend more preparation time on tasks that influence multiple score areas.
By focusing on the right PTE question weightage and mastering the important PTE questions, candidates can improve their preparation efficiency and achieve better results in the PTE Academic exam.
How These Sections Impact Your Overall PTE Score
Each section contributes to your final PTE score (10–90 scale), but the impact of individual tasks varies. Understanding the pte score distribution helps candidates identify which tasks have a stronger influence on their overall result. High-impact integrated tasks can improve multiple skill areas together, making them important for candidates targeting higher scores such as 65+, 79+, or 90.
For example:
Repeat Sentence can improve both Speaking and Listening scores.
Read Aloud supports Speaking fluency and Reading performance.
Write From Dictation strengthens Listening accuracy and Writing ability.
Reading Fill in the Blanks improves vocabulary, grammar, and reading accuracy.
Understanding the PTE exam sections and pte score distribution chart allows candidates to prepare strategically instead of spending equal time on every question type. By focusing on high-impact tasks and analyzing the pte marks distribution, students can identify score improvement opportunities and build a more effective preparation plan. The pte marks distribution also helps candidates understand how different question types contribute to their final score and where focused practice can create the biggest improvement.
How the New PTE Score Chart Is Calculated
The pte score chart is powered by advanced AI scoring technology designed to evaluate real communicative ability rather than subjective examiner judgment. Unlike traditional band-based exams, the pte scoring chart uses a fully automated algorithm that calculates performance across both individual and integrated tasks.
This means your pte scores are not based on a human examiner’s opinion , they are generated through data-driven assessment models trained on thousands of real test responses.
1. AI-Based Scoring Technology
The new pte score chart relies on artificial intelligence to assess:
Oral fluency
Pronunciation
Grammar accuracy
Vocabulary range
Spelling
Content relevance
For Speaking and Writing, the system analyzes:
Speech patterns
Pause frequency
Intonation consistency
Sentence complexity
Because scoring is automated:
Results are consistent
Bias is minimized
Re-scoring outcomes are rare
This is a major difference compared to traditional band systems.
2. Integrated Task Scoring
One unique feature of the pte scoring chart is integrated scoring.
Many tasks contribute to multiple skill scores at the same time.
For example:
Repeat Sentence affects both Speaking and Listening
Reading & Writing Fill in the Blanks affects Reading and Writing
Write from Dictation impacts Listening and Writing
So the new pte score chart does not evaluate skills in isolation. It measures how effectively you process and respond to language across skills.
This is why improving one task can boost multiple sections in your final pte scores.
3. Skill Scores + Overall Score Calculation
The system generates:
Listening (10–90)
Reading (10–90)
Speaking (10–90)
Writing (10–90)
These are then combined algorithmically to produce your Overall Score (10–90).
Important:
Your overall score is not a simple average.
It reflects weighted performance across all communicative skills.
That’s why:
A weak Speaking score can restrict your total score
Strong integrated task performance can accelerate improvement
4. Why the New PTE Score Chart Is More Precise
Compared to band systems:
It measures granular performance differences (e.g., 67 vs 69)
It avoids broad band grouping
It allows universities and immigration bodies to interpret ability more precisely
PTE Scoring Changes 2026: What Candidates Need to Know
The PTE scoring system 2026 continues to focus on measuring real English communication ability rather than memorised responses. The latest approach places greater importance on how naturally and effectively candidates use English across Speaking, Writing, Reading, and Listening tasks.
Understanding these changes is essential for students preparing for higher targets such as PTE 65+, 79+, or 90, as preparation strategies need to focus on actual language skills rather than only exam techniques.
Increased Focus on Natural Communication
The updated PTE scoring approach places more emphasis on authentic communication. Candidates are rewarded for responses that demonstrate clear meaning, logical structure, and natural language usage.
Instead of relying heavily on fixed templates, students should focus on:
Delivering responses naturally
Expressing ideas clearly
Maintaining logical flow
Using appropriate vocabulary for the situation
A natural communication style helps demonstrate genuine English proficiency and supports stronger performance across multiple tasks.
More Importance on Fluency and Pronunciation
Speaking performance continues to depend heavily on oral fluency and pronunciation. The scoring system evaluates how clearly and smoothly candidates communicate their ideas.
Key areas that influence speaking performance include:
Consistent speaking pace
Clear pronunciation
Correct word stress and rhythm
Reduced hesitation and unnecessary pauses
Candidates targeting higher PTE scores should focus on developing controlled fluency instead of simply speaking faster.
Greater Emphasis on Original Responses
The PTE exam rewards responses that show genuine understanding and relevant content. Candidates should avoid depending entirely on memorised answers that may sound unnatural or disconnected from the question.
High-scoring responses should include:
Relevant ideas
Personalised examples where appropriate
Natural sentence structures
Clear communication of meaning
Using preparation frameworks is helpful, but responses should remain flexible and adapted to each question.
Better Performance Analysis Through Detailed Score Reporting
The updated scoring approach provides candidates with clearer insights into their performance. Instead of focusing only on the overall score, students can analyse individual skill areas and identify specific improvement opportunities.
A detailed score analysis helps candidates understand:
Which communicative skill needs improvement
How enabling skills affect performance
Which tasks are limiting score growth
Where preparation efforts should be focused
By understanding these PTE scoring changes 2026, candidates can create a more effective preparation strategy and focus on improving the skills that have the greatest impact on their final PTE score.
How the Three Layers Work Together
You can think of the report like this:
Enabling Skills → Affect Communicative Skills → Determine Overall PTE Score
Example analysis:
If:
Overall Score = 72
Speaking = 68
Pronunciation = Low
Your improvement focus should be pronunciation drills and fluency control not just more practice tests.
Without analyzing enabling skills, many students repeat the same mistakes and remain stuck in the 65–70 range.
How to Read Your Official PTE Scores Report Strategically
Follow this 4-step method:
Step 1: Check your overall PTE score
Step 2: Identify the lowest communicative skill
Step 3: Match it with related enabling skills
Step 4: Target the root weakness directly
This transforms your preparation from random practice into performance engineering.
Why This Section Matters for High Scores 79+ Target
To move from 65 to 79+, you must:
Eliminate enabling skill weaknesses
Balance all communicative scores
Avoid having one module 8–10 points lower than others
The official PTE scores report is not just a result sheet it is a precision diagnostic tool.
Candidates who understand this structure improve faster, attempt fewer retakes, and cross competitive score thresholds more efficiently.
How PTE Score Changes Affect Your Preparation
The latest PTE scoring approach requires candidates to focus on overall communication ability rather than only memorising templates. Your preparation strategy should match your target score and the skills required to achieve it.
For 65+ Target
Candidates aiming for a PTE score of 65 or above should focus on building strong fundamentals and improving accuracy across all sections.
Focus on:
Accuracy in responses
Building core vocabulary
Improving grammar consistency
Practising high-impact PTE tasks such as Repeat Sentence, Read Aloud, and Write From Dictation
Maintaining steady performance across Speaking, Writing, Reading, and Listening
A balanced preparation approach helps improve overall scores and reduces the impact of mistakes in individual question types.
For 79+ Target
Candidates targeting 79+ in PTE need a more advanced preparation strategy focused on communication quality and consistency.
Focus on:
Advanced fluency and natural speaking delivery
Better pronunciation control
Strong listening retention skills
Managing complex vocabulary and sentence structures
Achieving balanced module scores across all four skills
For higher PTE scores, small improvements in fluency, pronunciation, and accuracy can significantly impact the final result.
PTE Score Chart Comparison: IELTS, TOEFL & CLB
Many students preparing for study or migration want to understand how the pte score chart compares with other major English exams. Since PTE uses a 10–90 scale instead of bands, candidates often search for pte score in bands, “PTE score equivalent,” or pte scores comparison with IELTS, TOEFL, and CLB levels.
Below is a simplified and widely accepted comparison table to help you interpret score equivalency clearly.
PTE Score Chart Comparison Table
| PTE Score | IELTS Band | TOEFL iBT | CLB Level (Canada) | Proficiency Level |
| 85–90 | 9.0 | 115–120 | CLB 10 | Expert |
| 79–84 | 8.0–8.5 | 110–114 | CLB 9–10 | Advanced |
| 65–78 | 7.0–7.5 | 94–109 | CLB 8–9 | Upper-Intermediate to Advanced |
| 59–64 | 6.5 | 79–93 | CLB 7 | Upper-Intermediate |
| 50–58 | 6.0 | 60–78 | CLB 6–7 | Intermediate |
| 42–49 | 5.5 | 46–59 | CLB 5–6 | Lower-Intermediate |
| 30–41 | 4.5–5.0 | 32–45 | CLB 4–5 | Basic |
This pte score chart comparison helps universities, immigration departments, and employers interpret your English proficiency accurately.
PTE Score Equivalent for Migration CLB Focus
For Canadian immigration, CLB (Canadian Language Benchmark) mapping is critical.
For example:
PTE 65+ → Typically aligns with CLB 8–9
PTE 79+ → CLB 9–10 (strong PR advantage)
Understanding your pte score chart equivalent in CLB terms can directly impact CRS points calculation.
PTE vs TOEFL Comparison
Unlike IELTS bands (0–9), TOEFL uses a 0–120 scale.
Comparison highlights:
PTE 79+ ≈ TOEFL 110+
PTE 65 ≈ TOEFL 94–100
PTE 50 ≈ TOEFL 60–78
The pte scores comparison shows that PTE’s 10–90 granular scale provides more precise differentiation between candidates compared to broader band systems.
What Is a Good PTE Score?
A good PTE score depends entirely on your goal whether you are applying for university admission, a student visa, or skilled migration. There is no single “perfect” number. Instead, the required PTE score varies based on institution, country, and visa category.
In general:
A good PTE score depends on your goal. Most universities require 58–65 PTE scores, while migration categories may require 65–79+.
Understanding this difference is crucial before setting your target.
PTE Scores for University Admission
Universities set minimum English proficiency requirements based on course level.
Undergraduate Programs
• Approx 51–60+ PTE score
This range is commonly accepted for:
Diploma programs
Foundation courses
Bachelor’s degrees
Some competitive universities may require 58+ overall with no communicative skill below 50–55.
Postgraduate Programs
• Approx 57–67+ PTE score
Master’s and advanced academic programs typically require:
Higher academic writing ability
Strong listening comprehension
Balanced communicative skills
More competitive institutions may require 65+ overall with minimum sub-score conditions.
So, for university admission, a good PTE score usually starts at 58 and becomes competitive at 65+.
PTE Scores for Visa Requirements
Visa English requirements often differ from academic entry standards.
Student Visa
• Around 58+ PTE score
Many countries require proof of English for student visa approval.
In most cases, 58+ meets minimum threshold requirements.
However:
Some programs may require higher scores
Individual course conditions may apply
Skilled Migration / High Education Categories
• Around 65–79+ PTE score
For migration pathways, pte scores for PR become more competitive.
Typical ranges:
65+ → Competent / Proficient English category
79+ → Superior English category (higher migration points)
Higher English scores can:
Increase migration ranking points
Improve PR eligibility
Strengthen skilled occupation applications
So, What Is Considered a Good PTE Score?
Here’s a simplified benchmark:
| Goal | Good PTE Score Range |
| Diploma / UG Admission | 51–60+ |
| Postgraduate Admission | 57–67+ |
| Student Visa | 58+ |
| Skilled Migration | 65–79+ |
Remember:
The required PTE score always depends on:
Country regulations
Visa stream
Course competitiveness
Institutional policy
Key Takeaway
A good PTE score is not universal it is goal-driven.
If your target is university admission → Aim for 58–65.
If your goal is skilled migration or PR → Aim for 65–79+.
Before preparing, always confirm the exact required PTE score for your chosen university or migration category.
How to Improve Your PTE Scores Based on the Score Chart
Understanding the score chart is not enough you must use it strategically. Whether you’re aiming for university admission or higher pte scores for PR, improvement starts with analyzing your current position and closing the right performance gap.
Here are expert-backed interpretation tips based on the PTE score chart structure:
1. Identify Your Score Zone
First, locate where you fall:
50–58 range → Foundation improvement needed
59–65 range → Refinement and consistency stage
66–75 range → Advanced polishing required
79+ target → Precision-level mastery
Each zone requires a different preparation strategy.
2. Analyze Communicative Score Imbalance
If one module is 8–10 points lower than others, that module is restricting your overall result.
Example:
Listening: 80
Reading: 76
Writing: 74
Speaking: 66
Your Speaking score is limiting your total band potential. Improving your weakest skill has the highest impact on final score growth.
3. Use Enabling Skills as Diagnostic Clues
Low Pronunciation → Work on clarity and stress patterns
Low Oral Fluency → Reduce hesitation and fillers
Low Grammar → Practice sentence correction and complex structures
Low Spelling → Improve Write From Dictation accuracy
Instead of repeating full mock tests, fix the micro-weakness shown in your score report.
4. Break the 65–79 Barrier Strategically
The jump from 65 to 79 is not about doing more practice it’s about increasing:
Vocabulary sophistication
Sentence complexity
Listening retention
Fluency rhythm consistency
Advanced score improvement requires controlled performance, not just familiarity with question types.
5. Focus on High-Weight Tasks
Some tasks influence multiple skills:
Repeat Sentence
Reading & Writing Fill in the Blanks
Write From Dictation
Improving these tasks can boost more than one communicative score at the same time.
Expert Tip
Don’t prepare for a number.
Prepare for the performance level required by that number.
For example:
58 requires functional clarity
65 requires consistent accuracy
79 requires advanced academic fluency
Understanding the score chart this way transforms preparation into performance engineering.
Why Memorised Templates Can Reduce PTE Performance
PTE Academic rewards natural communication skills rather than simple memorisation. While using a structure can help organise your ideas and improve response flow, relying too heavily on memorised templates can negatively affect your performance.
Overused or robotic templates may make your responses sound unnatural and can reduce your ability to answer questions accurately. Candidates should focus on adapting their responses based on the question while maintaining clear communication.
Focus on:
Relevant answers – Provide responses that directly address the question instead of using unrelated memorised content.
Natural speaking – Maintain a conversational tone with natural pauses, rhythm, and delivery.
Logical development – Organise your ideas clearly with a strong beginning, supporting points, and conclusion.
Clear pronunciation – Prioritise accurate pronunciation, fluency, and easy understanding.
Using flexible structures combined with genuine responses helps candidates perform better in PTE Speaking and Writing tasks while meeting the expectations of the updated scoring system.
Why Choose One Australia Education Group for PTE Academic Preparation?
One Australia Education Group is built for students who want structured, result-focused PTE academic preparation aligned with the latest PTE score chart 2026 and real exam expectations. Our training approach is designed to help you clearly understand scoring patterns and convert preparation into measurable score improvement.
Through expert-led PTE coaching classes, students receive module-wise guidance in Speaking, Writing, Reading, and Listening with practical strategies based on updated scoring behavior. Every session focuses on accuracy, fluency, and exam-smart techniques that directly impact your final PTE performance.
With flexible PTE academic online learning, you can prepare from anywhere while following a structured study plan, regular practice sessions, and personalized feedback. This makes it ideal for both working professionals and international students who need consistency without compromising quality.
Overall, One Australia Education Group combines expert mentorship, updated exam strategies, and result-driven PTE preparation methods to help you confidently target higher scores and achieve your study abroad or migration goals.
Conclusion
The pte score chart is more than just a scoring table, it is a complete framework that helps students understand their English proficiency in a structured, measurable, and globally accepted way. From the pte new score chart and pte band score chart latest updates to detailed module-wise performance, score distribution patterns, and breakdown analysis, every part of the system is designed to give a clear picture of real language ability.
By studying the pte score distribution chart and pte score breakdown, candidates can identify their strengths and weaknesses across Listening, Reading, Speaking, and Writing, and understand why certain score improvements are easier than others. The CEFR mapping and comparison with IELTS, TOEFL, and CLB further help in translating PTE scores into academic and immigration requirements.
Ultimately, success in PTE is not just about practicing more, it is about understanding the scoring system behind the pte score chart and using it strategically. Once students decode how AI scoring, integrated tasks, and module weighting work, they can plan smarter preparation, improve faster, and achieve higher scores with clarity and confidence.
FAQ
1. What is the latest PTE score chart?
The latest pte score chart 2026 follows a 10–90 scale aligned with CEFR levels (A1 to C2). It reflects AI-based scoring across Listening, Reading, Speaking, and Writing modules. The scoring scale in the pte score chart remains consistent, though task updates may occur periodically.
2. How does the new PTE score chart work?
The new pte score chart works through AI-based evaluation. It measures communicative skills and integrated tasks, then calculates individual module scores (10–90) and an overall score based on weighted performance. This PTE score breakdown ensures each skill contributes accurately to the final result.
3. What is PTE score in bands?
PTE does not officially use bands like IELTS. However, many students refer to “PTE score in bands” when comparing ranges using a PTE band score chart for better understanding. For example, PTE 65 is roughly equivalent to IELTS 7.0, and PTE 79 aligns with IELTS 8.0.
4. What is the difference between PTE score table and scoring chart?
A PTE score table shows numerical ranges and their proficiency levels (e.g., 65 = B2/C1 level).
A pte score chart 2026 explains how scores are calculated, distributed, and interpreted across skills. A PTE score distribution chart also helps visualize how most candidates perform across score ranges.
5. Is the PTE score chart accepted for Australia PR and student visas?
Yes, the pte score chart 2026 is officially accepted for Australian student visas and PR applications. The Department of Home Affairs recognizes PTE Academic scores for migration and visa purposes.
6. How is the PTE score distribution chart useful for preparation?
The PTE score distribution chart helps candidates understand how scores are typically spread among test takers. It shows why most students cluster in the 50–65 range and why achieving 79+ requires advanced preparation beyond average performance.
7. What does the PTE score breakdown mean?
The PTE score breakdown explains how each module (Listening, Reading, Speaking, Writing) contributes individually to your overall score. It helps identify weak areas so you can improve specific skills instead of focusing only on total marks.
8. Is there a difference between the PTE new score chart and old system?
Yes, the new pte score chart uses enhanced AI-based evaluation with more accurate skill measurement. While the 10–90 scale remains the same, scoring precision and integrated task weighting have improved compared to earlier versions.
9. What is included in the PTE band score chart latest updates?
The latest PTE band score chart is commonly used by students for IELTS comparison. It includes updated equivalency mappings between PTE, IELTS, TOEFL, and CLB, helping users understand migration and academic requirements more clearly.
10. How does the PTE score chart help in improving results?
The pte score chart 2026 helps students analyze performance in each module and understand score patterns. By studying it alongside the PTE score breakdown, candidates can focus on weak sections and strategically improve their overall score.
Malcolm
Malcolm is a highly respected PTE 90 scorer, coach, and mentor at One Australia Group, known for his practical strategies and result-oriented teaching style. With years of experience in PTE, IELTS, and NAATI coaching, he has guided thousands of students towards achieving their desired scores and fulfilling their migration or study goals. As a tutor, Malcolm is best recognized for breaking down complex exam tasks into simple, actionable steps. From mastering PTE Speaking tasks like Read Aloud, Repeat Sentence, and Describe Image, to perfecting Writing, Reading, and Listening strategies, his techniques are trusted by students worldwide. He also provides structured daily practice timetables, emphasizing smart preparation and bulk practice for high-scoring tasks. Beyond PTE, Malcolm is deeply committed to improving students’ grammar, vocabulary, and academic writing skills, often conducting specialized grammar classes. His approach combines updated exam insights, effective templates, and natural communication skills, ensuring students are well-prepared even with the latest exam changes such as human evaluation. Malcolm is also the founder of MockMaster.AI, a free AI-powered portal that offers unlimited scoring, mock tests, prediction files, and practice materials, making professional preparation accessible to everyone. Alongside PTE, he actively promotes NAATI CCL coaching in multiple languages, guiding students towards gaining valuable PR points for Australia. Widely admired for his dedication and expertise, Malcolm continues to inspire students through his YouTube sessions, classroom teaching, and online platforms, proving that with the right guidance, achieving your dream score is always within reach.